Spreading
Research Project
PSU Centre for Pollination Research
2021
Research Question
How can design make visible the slow, unseen ways climate change moves through bodies, species, and everyday environments?
Overview
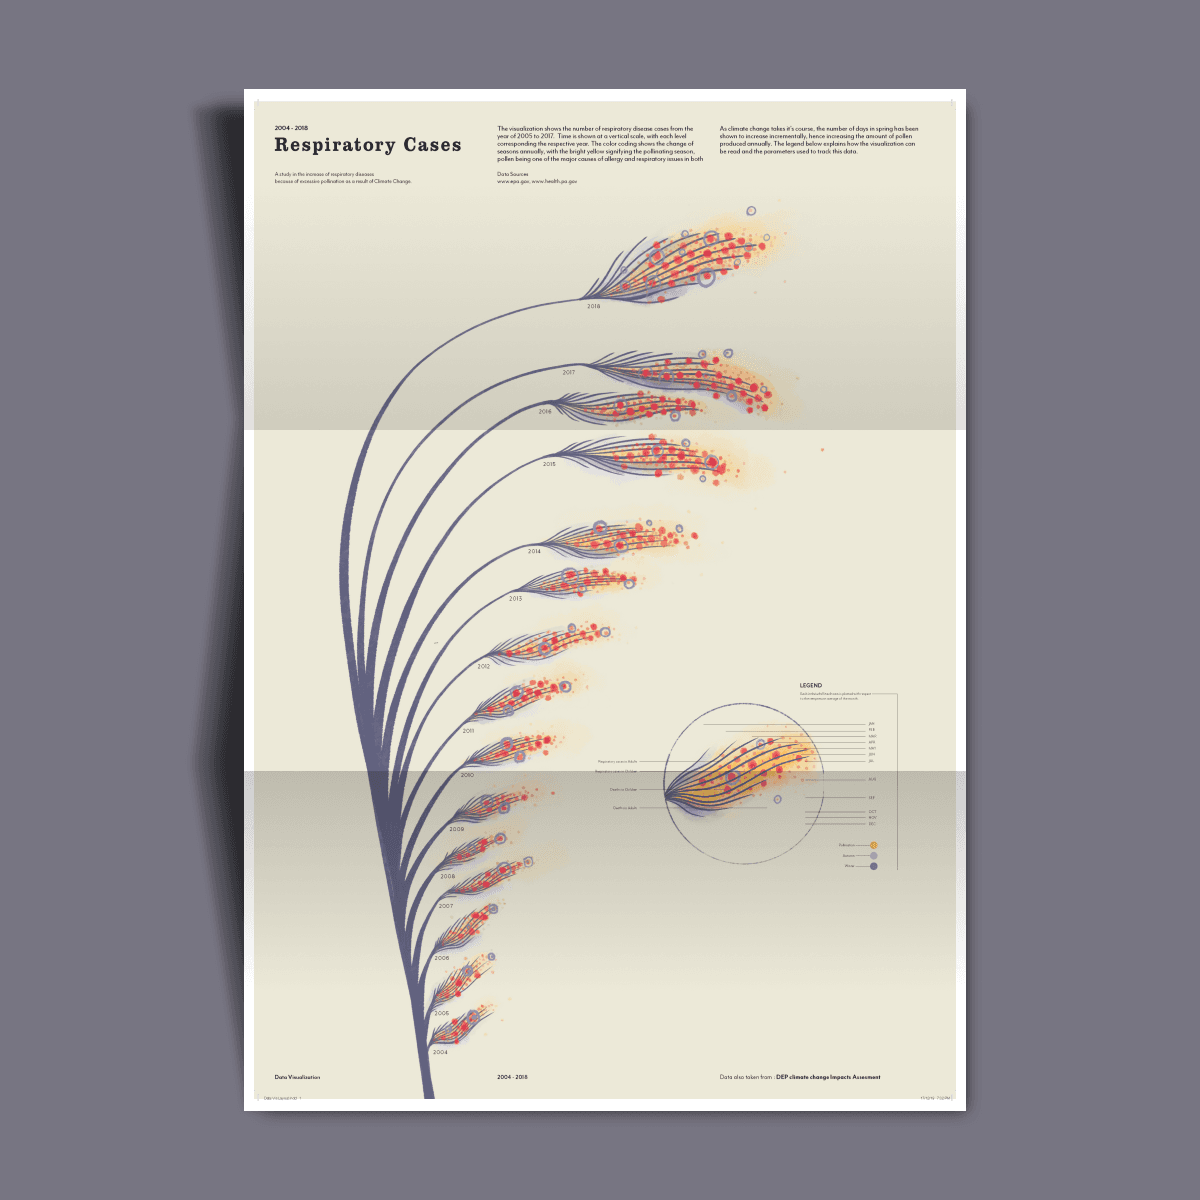
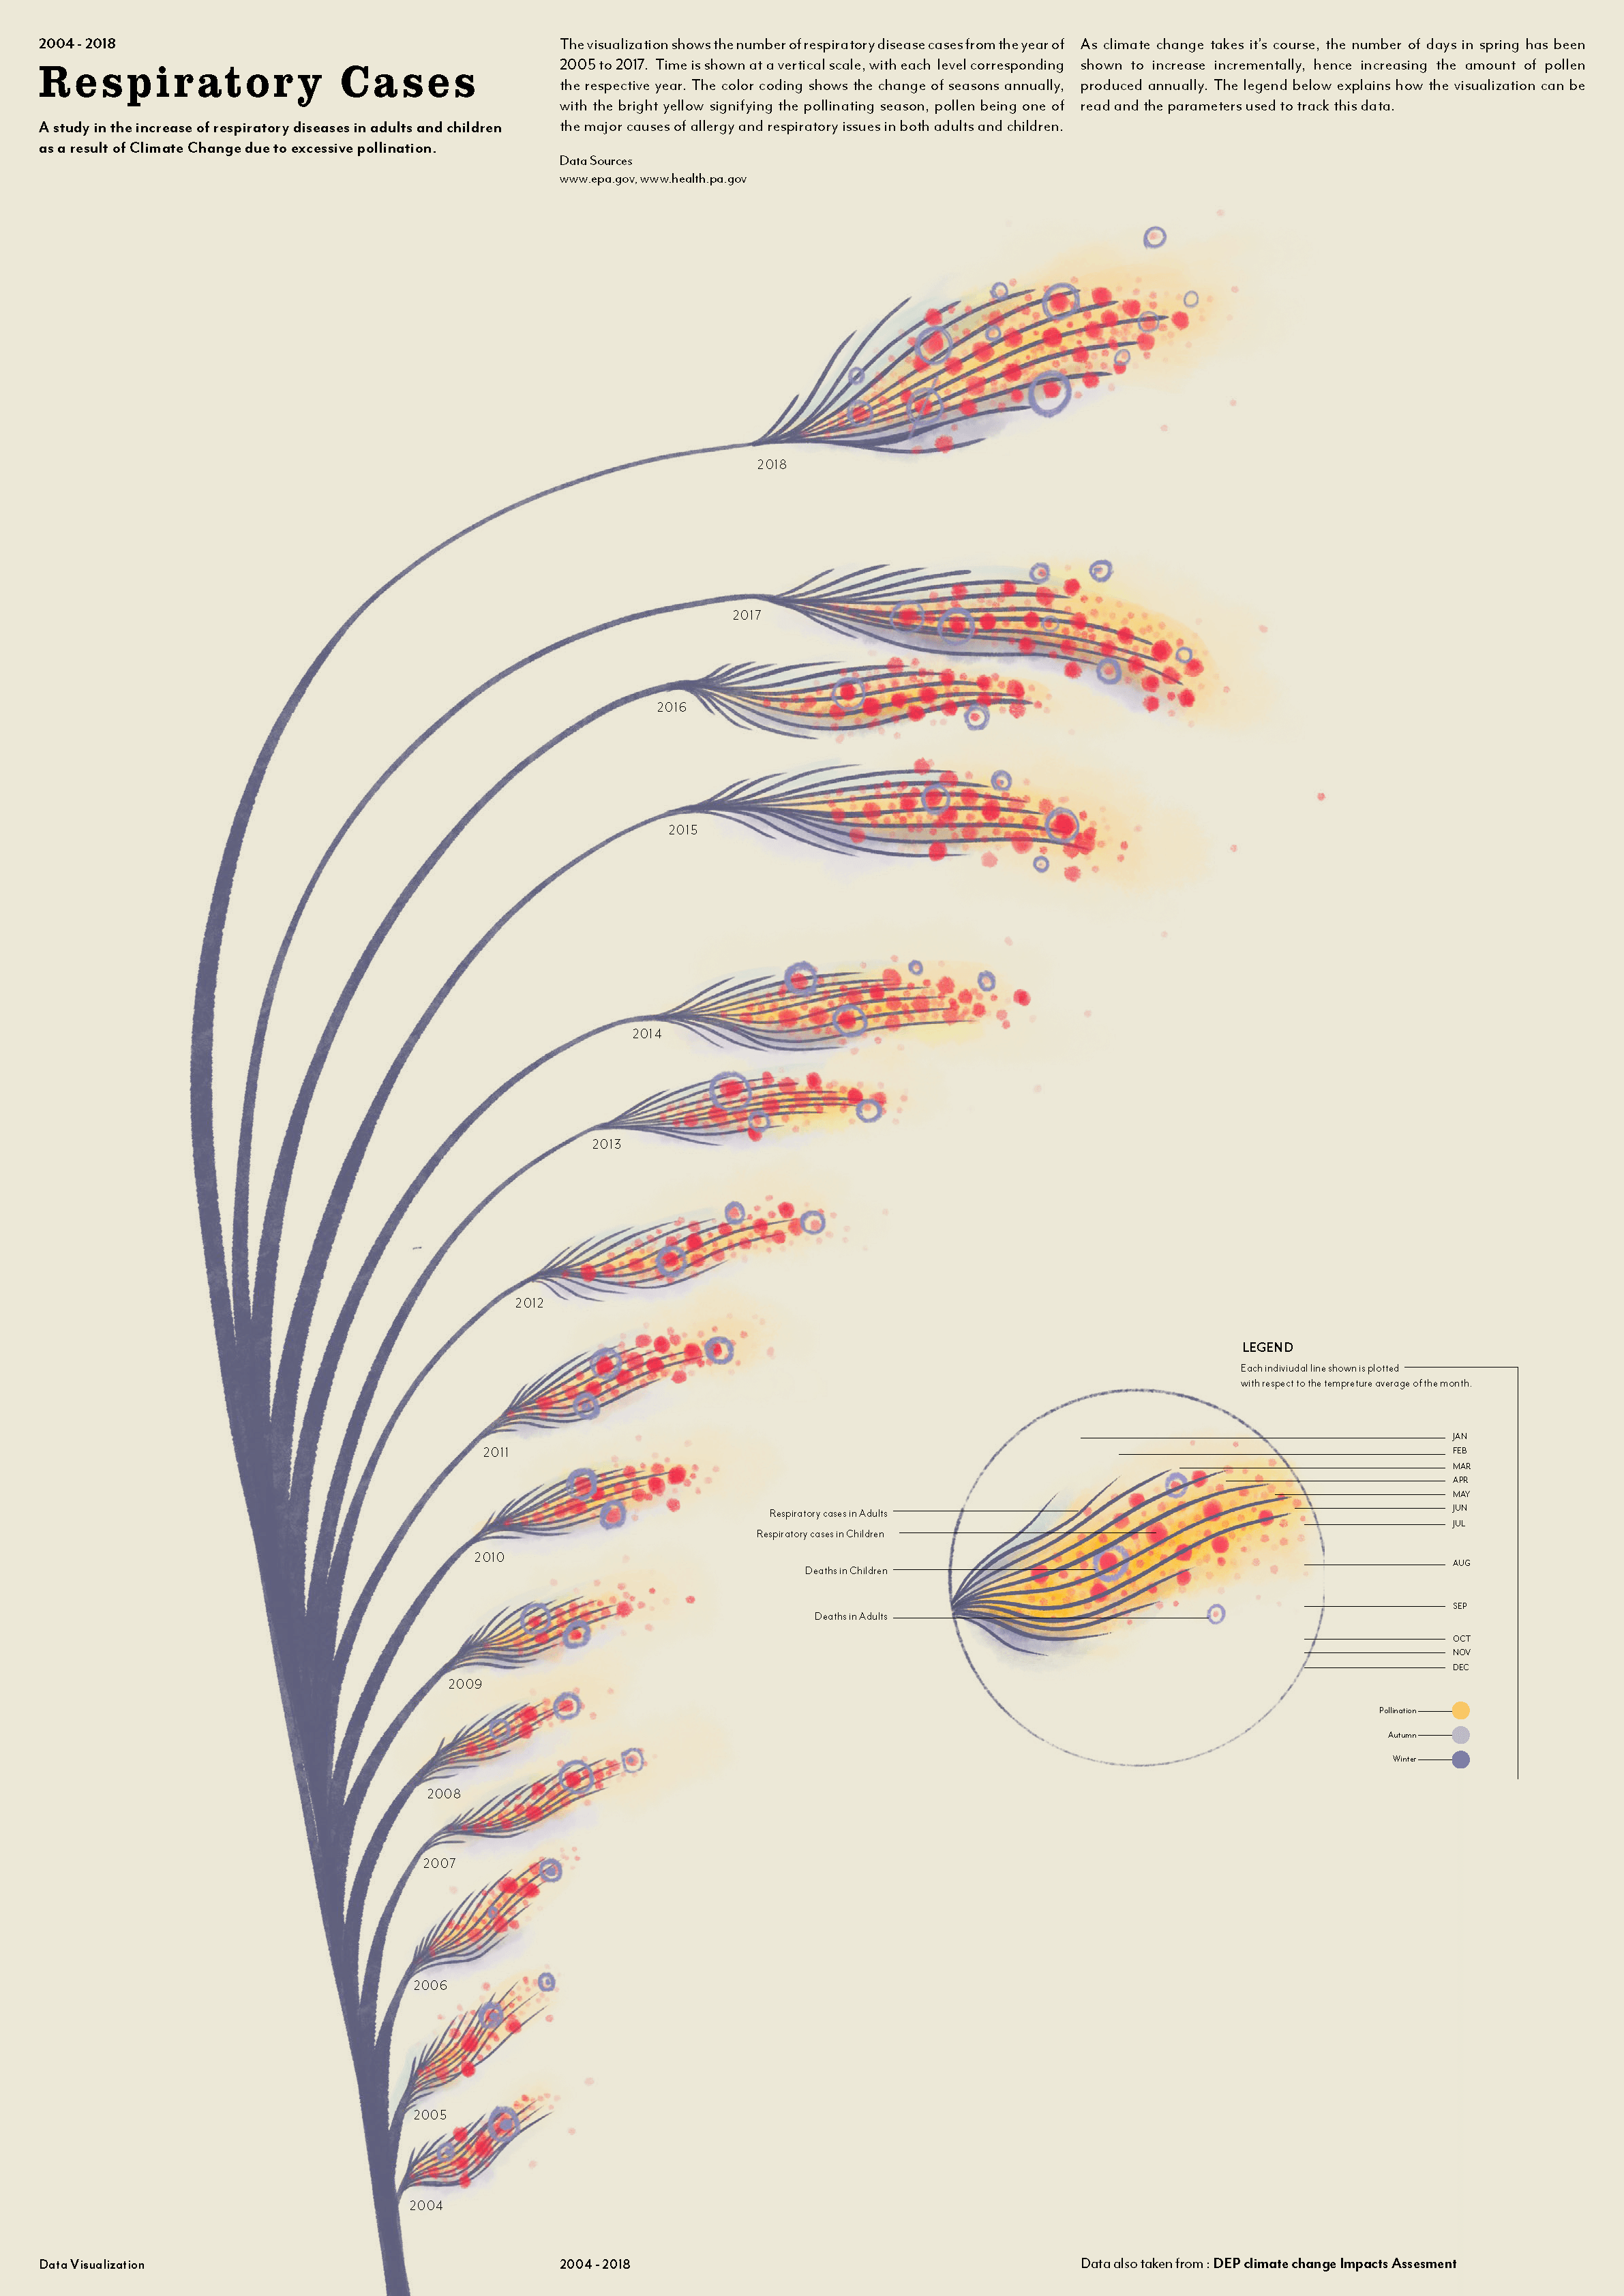
Spreading is a data visualization project investigating how climate change registers in the body and the local environment. Working with datasets from Penn State's Centre for Pollination Research, the project examined rising temperatures, shifting species patterns, and pollutants to surface connections between air quality, climate, and respiratory health. Hand-plotted elements were combined with digital composition to retain a tactile, human quality the data alone cannot carry.
Process
The project moved between datasets and drawing. Pastel yellows traced pollen levels through the year; red accents registered mortality linked to respiratory illness. Each iteration tested how much information the eye could hold without losing the weight of what the numbers describe. Hand-plotting slowed the work, and that slowness became part of the method — to draw one data point at a time is to attend to it differently than to plot it.


Findings
Spreading argues that data visualization, especially of phenomena that go unseen, depends on editorial decisions only a designer can make. The dataset alone does not carry meaning; the choices of medium, mark, color, and pace shape what becomes visible and how it is felt. The work proposes that the designer's role in data visualization is not neutral translation but editorial judgment grounded in the nature of the data itself.
data humanism, data as material practice
Set in Jetbrains
Created in Framer
© Anjana Padmakumar